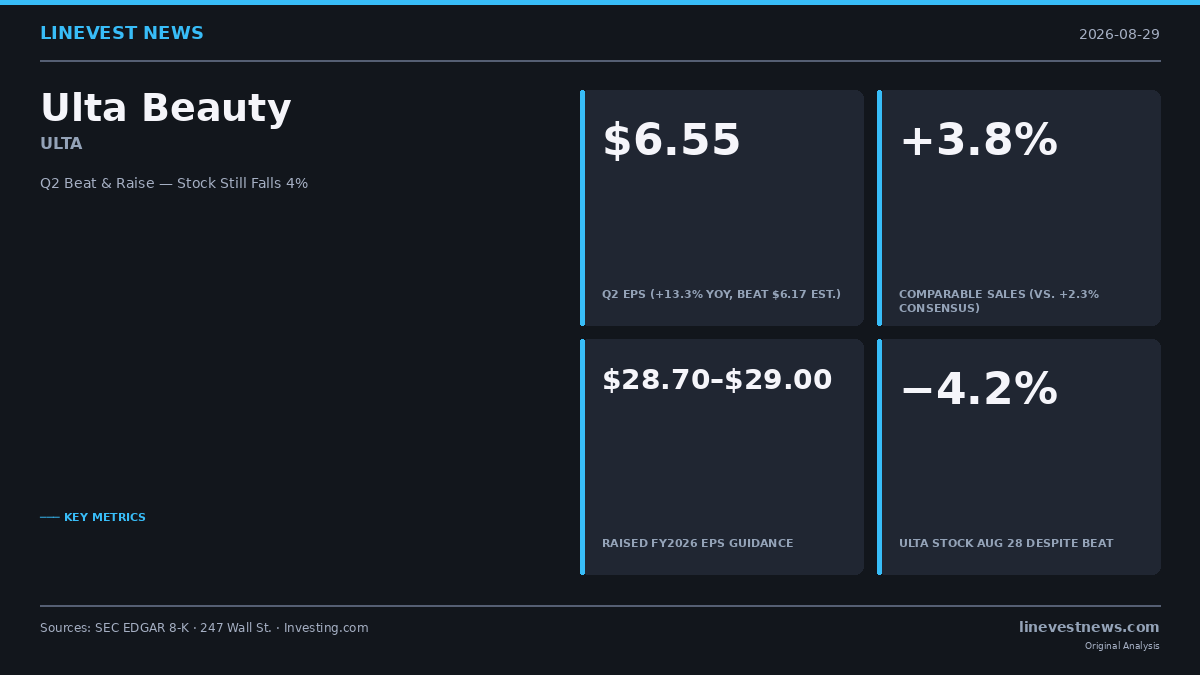
TL;DR - Ulta Beauty reported Q2 FY2026 EPS of $6.55, beating the $6.17 consensus by $0.38; revenue rose 8.9% to $3.04 billion, topping the ~$2.99 billion estimate - Comparable sales grew +3.8%, well ahead of the +2.3% consensus — fragrance led at high-teens growth for the quarter - Full-year EPS guidance was raised to $28.70–$29.00; share buyback authorization increased to $1.8 billion - Despite the beat-and-raise, ULTA shares fell ~4.2% on August 28 to $517.18 — a recurring post-earnings pattern driven by comp deceleration, softer H2 guidance, and elevated positioning
Part A: The Quarter at a Glance
Ulta Beauty (NASDAQ: ULTA) reported second-quarter fiscal 2026 results on August 27, 2026 for the thirteen weeks ended August 1, 2026. All three headline metrics — revenue, comparable sales, and diluted EPS — beat the Wall Street consensus.
Q2 FY2026 vs. Consensus
| Metric | Q2 FY2026 | Prior Year (Q2 FY2025) | YoY | Consensus Est. |
|---|---|---|---|---|
| Net sales | $3,035.7M | ~$2,788M | +8.9% | ~$2,990M |
| Comparable sales | +3.8% | +6.7% | –290 bps | +2.3% |
| Gross profit | $1,187.0M | — | — | — |
| Gross margin | 39.1% | 39.2% | –10 bps | ~39.2% |
| Operating income | $379.6M | ~$344.7M | +10.1% | — |
| Operating margin | 12.5% | 12.4% | +10 bps | — |
| Net income | $282.0M | — | — | — |
| Diluted EPS | $6.55 | ~$5.78 | +13.3% | $6.17 |
Prior-year revenue and EPS are derived from YoY growth rates disclosed in the press release. Consensus estimates from Bloomberg/FactSet aggregates.
The comparable sales beat was the most notable element — at 3.8% versus the 2.3% consensus, Ulta outperformed by 150 basis points. E-commerce comps grew in the high teens for the sixth consecutive quarter, with mobile accounting for more than 60% of online sales. The loyalty program reached approximately 47 million active members, up 3% year over year.
Category Performance (Comparable Sales)
| Category | Q2 FY2026 Performance |
|---|---|
| Fragrance | High-teens growth (strongest) |
| Haircare | High-single-digit growth |
| Services (salon) | Mid-single-digit growth |
| Makeup | Flat |
| Skincare & wellness | Modestly negative |
K-Beauty remained a notable momentum driver within fragrance and broader beauty. Fragrance's outperformance continued a multi-quarter trend, reflecting premiumization across the customer base. Skincare and wellness declining modestly is a headwind worth monitoring, as this segment represents a significant addressable market for the company.
Balance Sheet and Cash Generation
| Item | As of August 1, 2026 |
|---|---|
| Cash + short-term investments | $213M |
| Merchandise inventory | $2,406M |
| Short-term debt | $340M |
| H1 FY2026 operating cash flow | $381.6M |
| H1 FY2026 capital expenditures | $139.5M |
| H1 free cash flow (implied) | ~$242M |
Inventory of approximately $2.4 billion was essentially flat year over year, indicating clean channel conditions without excess build — a constructive signal for gross margin durability heading into the holiday season.
CEO Kecia Steelman commented: "Our team delivered another impressive quarter of strong sales, profit, and earnings growth, demonstrating execution with discipline."
Guidance Raised Across All Metrics
| Metric | Prior FY2026 Guidance | Updated FY2026 Guidance |
|---|---|---|
| Net sales growth | 6.0–7.0% | 6.7–7.2% |
| Comparable sales growth | 2.5–3.5% | 3.2–3.7% |
| Operating income growth | 6.5–9.0% | 8.3–9.3% |
| Diluted EPS | $28.36–$28.80 | $28.70–$29.00 |
| Capital expenditures | $400–$450M | Unchanged |
Management also increased the full-year share repurchase authorization to $1.8 billion from $1.5 billion. As of August 1, $1.0 billion remained available under the program.
For the second half specifically, management guided for net sales growth of 4–5% and comparable sales of 2–3%, a step-down from the 3.8% comp achieved in Q2.
Part B: Anatomy of a Post-Earnings Drop
Despite a clean beat-and-raise, Ulta shares closed at $517.18 on August 28 — a decline of approximately 4.2% from the prior session close of $540.10. This follows a 4.78% drop after Q1 FY2026 results and similar sell-offs in prior years despite earnings beats. Understanding why strong results produce negative reactions is central to evaluating beauty retail equities.
Mechanism 1: Elevated Positioning and Profit-Taking
ULTA stock had moved higher heading into the earnings release, creating a classic "buy the rumor, sell the news" dynamic. A critical reference point: the retail sector ETF (XRT) gained 0.7% on August 28 — ruling out broad sector weakness or macro headwinds as an explanation. The decline was company-specific and consistent with crowded positioning ahead of a known catalyst.
This pattern is not new for Ulta. The stock declined 4.78% after Q1 FY2026 results as well, despite that quarter also beating estimates. When expectations are priced to perfection, even a solid beat rarely moves the needle higher.
Mechanism 2: Comparable Sales Deceleration Trajectory
The core concern is not the absolute comp figure (+3.8% is solid absolute growth) but the trajectory. Q2 FY2025 comparable sales were +6.7%. Year over year, the growth rate has effectively halved:
| Period | Comparable Sales Growth |
|---|---|
| Q2 FY2025 | +6.7% |
| Q2 FY2026 (actual) | +3.8% |
| H2 FY2026 (guidance midpoint) | ~2.5% |
Management's H2 comp guide of 2–3% confirms the deceleration will continue, as Ulta faces increasingly difficult year-over-year comparisons from late fiscal 2025. The market is pricing not the current beat but the implied forward run-rate: a business comping at 2–3% is valued differently from one comping at 6–7%.
This is not an alarming shift — management cited tougher base-period comparisons as the primary driver — but it does represent a structural change in the growth narrative that investors must reprice.
Mechanism 3: Gross Margin Flat to Slightly Lower
Gross margin declined 10 basis points to 39.1%, modestly below the ~39.2% consensus. While operating margin improved 10 basis points to 12.5% (aided by SG&A deleverage improvement), the gross margin trend leaves limited room for multiple expansion. In a period when many specialty retailers have seen gross margin tailwinds from easing supply chains, a flat or slightly negative gross margin signals that Ulta's mix shift toward services and premiumization has not yet produced the hoped-for margin uplift.
UBS specifically cited margin pressure as the reason for lowering its price target post-quarter, though the firm maintained its Buy rating.
The e.l.f. Beauty Sympathy Sell
e.l.f. Beauty (NYSE: ELF), often used as a barometer for mass-market beauty consumer appetite, fell 2% to $103.96 on August 28 in a sympathy move. ELF shares had gained approximately 40% year-to-date through August 27 — a strong run that made them susceptible to selling pressure on any signal of weakening beauty consumer trends. The ELF decline was reactive rather than fundamental; the company reports its own quarterly results separately.
Post-Earnings Analyst Reactions
| Firm | Rating | Price Target | Change |
|---|---|---|---|
| Goldman Sachs | Buy | $667 | Raised |
| Jefferies | Buy | $650 | Raised |
| Raymond James | Strong Buy | $700 | Reiterated |
| UBS | Buy | $710 | Lowered from $735 |
Among the 25 analysts covering ULTA, the consensus is "Moderate Buy" — 17 Strong Buy, 1 Moderate Buy, 6 Hold, and 1 Strong Sell. UBS was the only firm to reduce its price target, citing limited gross margin expansion potential. Goldman Sachs, Jefferies, and Raymond James all maintained constructive views with either raised or reiterated targets.
At Friday's closing price of $517.18, ULTA trades at approximately 18× the midpoint of FY2026 EPS guidance ($28.85) — a forward multiple that is not demanding for a company with 47 million loyalty members, a 47% return on equity, and consistent free cash flow generation.
Three Watch Points for H2 FY2026
1. Fragrance durability
High-teens comparable growth in fragrance drove the Q2 beat, led by premium and celebrity fragrance lines. The holiday season (Q3 and Q4 for Ulta's fiscal calendar) is historically important for gift-set inventory. If fragrance momentum sustains, reaching the upper end of the H2 comp guidance of 2–3% is achievable. If it moderates sharply, the lower end or a miss becomes more likely.
2. Skincare recovery
Skincare and wellness comped negatively in Q2. Clinical and active skincare has been a significant growth driver for competitors, and Ulta's ability to recapture consumer interest in this category — particularly given its broad assortment including both mass and prestige — will be a key swing factor in H2.
3. Buyback execution pace
With $1.0 billion remaining under the $1.8 billion authorization and the stock trading approximately 28% below its 52-week high of $714.97, buyback execution pace matters for per-share earnings support. H1 repurchases totaled $791.1 million (1.4 million shares) — an aggressive pace that management can sustain if the balance sheet remains clean.
Valuation Context
ULTA's 52-week range of $443.60 to $714.97 illustrates the extent of the de-rating the stock has undergone. Year-to-date through August 29, shares are down approximately 18.2% — underperforming the broader market.
At $517, the stock sits approximately 16% above its 52-week low, providing some valuation support. Forward P/E of roughly 18× compares favorably to specialty retail peers and reflects a market that has already discounted the comp deceleration narrative, though not necessarily fully priced in a scenario where comps continue to moderate below 2% in future quarters.
The company's structural advantages — the largest specialty beauty loyalty program in the United States at 47 million members, a proven services segment, and consistent capital return — remain intact. The question for investors is whether the current comp trajectory represents a temporary normalization following an exceptional post-pandemic cycle, or the beginning of a longer-term market share challenge.
Sources
- Ulta Beauty Q2 FY2026 Earnings Release — SEC EDGAR Ex. 99.1
- Ulta Beauty Announces Second Quarter FY2026 Results and Raises Guidance — Ulta Investor Relations
- Ulta Beauty Slips 4% Despite Raised Guidance and Q2 Earnings Beat — 247 Wall St.
- Ulta Beauty Q2 FY2026 Slides: Strong Beat, Muted Market Reaction — Investing.com
- UBS Lowers Ulta Beauty Stock Price Target on Margin Pressures — Investing.com
This article is for informational purposes only and does not constitute investment advice. LineVest News is not a registered investment advisor.