Kia (000270.KS) — Q1 FY2026 Financial Analysis
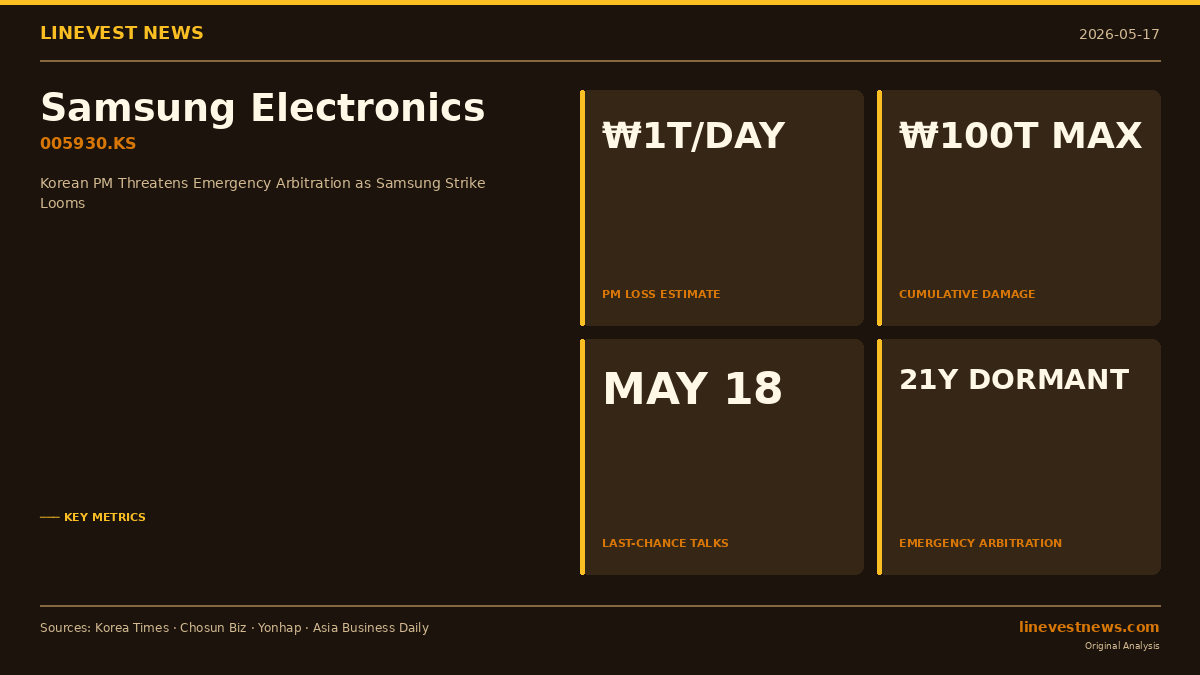
Record quarterly revenue at ₩29.5 trillion, steepest profit drop in three years — Kia's Q1 2026 forces a reckoning between concentrated tariff shock and structural margin erosion
Source: Q1 FY2026 Preliminary Earnings Disclosure — Filed April 24, 2026 with DART (rcept_no 20260424800317) | FY2025 Annual Business Report (rcept_no 20260312001224) | Q1 FY2025 Quarterly Report (rcept_no 20250515001947) | Consolidated Financial Statements | Unit: KRW billions
Note: The Q1 FY2026 quarterly report is scheduled for filing on May 14, 2026. Due to the lag in XBRL data availability, balance sheet and cash flow figures herein reflect the most recent fiscal year-end (FY2025, December 31, 2025).
Kia posted its highest-ever quarterly revenue of ₩29.50 trillion in Q1 FY2026, a 5.3% year-on-year increase — yet operating profit collapsed 26.7% to ₩2.21 trillion, driving the operating margin from 10.7% to 7.5%, a 3.2-percentage-point vertical drop in a single quarter. Three cost shocks converged simultaneously: ₩755 billion in U.S. tariff charges recognized within the period, ₩250 billion in foreign-currency warranty provision revaluation driven by a sharp won depreciation, and ₩215 billion in elevated European incentive spending. Against this, the structural signals point in the opposite direction — EV unit sales surged 54.1% year-on-year to 86,000 units, and Kia's global retail market share crossed 4.1% for the first time in the company's history. Whether the cost shock is a concentrated but transient headwind or the opening chapter of structural margin compression is the defining question for this stock over the next several quarters.
Balance Sheet
Figures as of December 31, 2025 (FY2025 year-end) vs. December 31, 2024 (FY2024 year-end). Source: DART Consolidated Financial Statements, fs_div=CFS.
Major Asset Movements
| Item | FY2024 (₩ trn) | FY2025 (₩ trn) | Change |
|---|---|---|---|
| Cash and cash equivalents | 13.57 | 14.00 | +3.2% |
| Short-term financial instruments | 5.29 | 7.66 | +45.0% |
| Short-term trade receivables | 3.56 | 3.55 | -0.3% |
| Inventories | 12.42 | 14.67 | +18.1% |
| Intangible assets | 4.09 | 4.81 | +17.4% |
| Investments in associates and JVs | 23.86 | 25.24 | +5.8% |
| Total assets | 92.76 | 98.98 | +6.7% |
Combined cash and short-term financial instruments reached ₩21.66 trillion at FY2025 year-end, up 14.9% from ₩18.85 trillion twelve months earlier. Kia achieved this liquidity build while simultaneously expanding dividends and executing share buybacks — a result that reflects the underlying cash generation capacity of the business and provides meaningful operational headroom in a period of tariff uncertainty.
Inventories expanded 18.1% to ₩14.67 trillion. The increase appears to reflect a combination of pre-tariff front-loaded U.S. shipments and inventory staged for new model launches. Whether this stock normalizes in subsequent quarters without requiring margin-dilutive clearance will be an important indicator of underlying demand health.
Intangible assets rose 17.4% to ₩4.81 trillion. Under K-IFRS, development-phase R&D expenditure that meets capitalization criteria is recorded as a development cost on the balance sheet rather than expensed immediately. The consistent accumulation signals ongoing capitalization of EV platform and software-defined vehicle (SDV) development costs. Accelerated amortization of these intangibles is a medium-term earnings watch item. Right-of-use assets under IFRS 16 edged up modestly from ₩0.35 trillion to ₩0.37 trillion, consistent with a manufacturing-heavy business model that carries limited lease leverage relative to distribution-oriented peers.
Debt Structure — Financial Liabilities vs. Operating Liabilities
Non-current bonds payable contracted sharply, falling 55.0% from ₩2.18 trillion (FY2024) to ₩0.98 trillion (FY2025), reflecting maturity repayment without material new issuance — a debt reduction comfortably funded by operating cash flow. Total consolidated liabilities stood at ₩37.79 trillion against equity of ₩61.19 trillion, yielding a debt-to-equity ratio of just 61.7%, conservative by the standards of global automotive peers. Liabilities grew only 2.4% while equity expanded 9.6%, meaning financial leverage is actively declining even as the absolute asset base grows.
Capital Quality
| Item | FY2024 (₩ trn) | FY2025 (₩ trn) | Change |
|---|---|---|---|
| Total equity | 55.84 | 61.19 | +9.6% |
| Retained earnings | 50.24 | 54.52 | +8.5% |
Retained earnings of ₩54.52 trillion represent 89.1% of total equity — a proportion that reflects three consecutive years of substantial profit retention rather than capital raising. Paid-in capital (share capital plus share premium) is largely static, so virtually the entire equity base is organic accumulation. Treasury stock purchases create a modest contra-equity adjustment, but its magnitude is immaterial relative to the retained earnings base. The quality of Kia's capital, built through operations rather than issuance, is a genuine balance sheet strength that distinguishes it from more leveraged global competitors.
Income Statement
Three-Year Annual Trend
Source: DART Consolidated Income Statement, fs_div=CFS, FY2023–FY2025 Annual Business Reports
| Item | FY2023 (₩ trn) | FY2024 (₩ trn) | FY2025 (₩ trn) | 2-yr CAGR |
|---|---|---|---|---|
| Revenue | 99.81 | 107.45 | 114.14 | +6.9% |
| Gross profit | 22.63 | 24.77 | 22.51 | — |
| Gross margin | 22.7% | 23.1% | 19.7% | — |
| Operating profit | 11.61 | 12.67 | 9.08 | -11.6% |
| Operating margin | 11.6% | 11.8% | 8.0% | — |
| Net income | 8.78 | 9.78 | 7.55 | -7.3% |
| Net margin | 8.8% | 9.1% | 6.6% | — |
Q1 Year-on-Year Comparison
Source: Q1 FY2025 DART Quarterly Report; Q1 FY2026 Preliminary Earnings Disclosure
| Item | Q1 FY2025 (₩ trn) | Q1 FY2026 (₩ trn) | YoY |
|---|---|---|---|
| Revenue | 28.02 | 29.50 | +5.3% |
| Operating profit | 3.01 | 2.21 | -26.7% |
| Operating margin | 10.7% | 7.5% | -3.2%p |
| Pre-tax income | — | 2.64 | — |
| Net income | 2.39 | 1.83 | -23.5% |
| Net margin | 8.5% | 6.2% | -2.3%p |
| Wholesale unit sales | 772,648 | 779,741 | +0.9% |
FY2025 full-year operating profit of ₩9.08 trillion represented a 28.3% retreat from the FY2024 peak of ₩12.67 trillion — a normalization from what was, by any historical standard, a supply-constrained supercycle. Q1 FY2026's 7.5% OPM continues the recovery gradient visible in FY2025's second half (Q3 FY2025: 5.1%, Q4 FY2025: 6.6%, Q1 FY2026: 7.5%), and the trajectory would likely have held at or near 10% in the absence of tariff-related charges.
Separating One-Time from Recurring Charges
The ₩2.21 trillion Q1 FY2026 operating profit absorbed three identifiable concentrated costs:
- U.S. tariff charges: ₩755 billion (explicitly disclosed in the preliminary earnings announcement)
- Warranty provision increase: ₩440 billion versus Q1 FY2025 — of which ₩250 billion reflected foreign-currency revaluation from won depreciation, and ₩190 billion reflected a structural increase tied to a higher EV sales mix
- European incentive escalation: ₩215 billion (IR conference call)
Stripping the tariff charge alone, operating profit would have been approximately ₩2.97 trillion and OPM approximately 10.0%, broadly comparable to Q1 FY2025's 10.7%. The ₩250 billion FX revaluation component of the warranty provision is mark-to-market in nature and will reverse if the won recovers — but the ₩190 billion EV-mix-driven component is a structural cost that scales with EV penetration and cannot be reversed through currency moves.
Gross Margin Deterioration
The gross margin compression from 23.1% in FY2024 to 19.7% in FY2025, a decline of 3.4 percentage points, was driven by cost of sales growing 10.8% from ₩82.68 trillion to ₩91.63 trillion against revenue growth of only 6.2%. Rising raw material costs, labor cost inflation, and warranty expense growth all contributed on the cost-of-sales line. Selling, general, and administrative expenses also expanded 11.0%, from ₩12.10 trillion to ₩13.43 trillion in FY2025, adding further pressure below the gross line. The gap between revenue and cost growth rates is the clearest single illustration of the profitability headwinds that characterize the current phase of Kia's earnings cycle.
Earnings Per Share
FY2025 basic EPS was ₩19,382 per share, down 22.1% from ₩24,893 in FY2024, as confirmed in the DART consolidated annual business report (rcept_no 20260312001224). Q1 FY2026 EPS remains unconfirmed pending formal quarterly report filing.
Cash Flow
Source: DART Consolidated Cash Flow Statement, fs_div=CFS, FY2025 vs. FY2024
| Item | FY2024 (₩ trn) | FY2025 (₩ trn) | Change |
|---|---|---|---|
| Operating cash flow | 12.56 | 9.05 | -27.9% |
| Investing cash flow | -10.15 | -4.96 | Improved |
| Financing cash flow | -3.57 | -4.18 | Larger outflow |
| Closing cash balance | 13.57 | 14.00 | +3.2% |
Free Cash Flow
FCF = Operating cash flow − Capital expenditures (acquisition of property, plant, and equipment)
- FY2025: ₩9.05 trillion − ₩3.76 trillion = ₩5.29 trillion
- FY2024: ₩12.56 trillion − ₩3.49 trillion = ₩9.08 trillion
Operating cash flow declined ₩3.5 trillion year-on-year, primarily reflecting the drop in net income from ₩9.78 trillion to ₩7.55 trillion. Non-cash items — depreciation, amortization, and provision movements — partially buffered the decline but did not fully offset the earnings reduction. FCF remains substantial at ₩5.29 trillion, more than sufficient to fund the shareholder return program without balance sheet deterioration.
Earnings Quality
Operating cash flow as a multiple of net income:
- FY2025: 9.05 / 7.55 = 1.20x
- FY2024: 12.56 / 9.78 = 1.29x
Both ratios exceed 1.0x for the second consecutive year, confirming that reported net income is being realized in cash. There is no evidence of trade receivables accumulation or revenue recognition inflation in the historical data — a clean signal in an environment where warranty accruals and provision movements make earnings quality analysis particularly important for auto manufacturers.
Capital Expenditure Profile
CapEx of ₩3.76 trillion in FY2025 equates to 3.3% of revenue, reflecting ongoing investment in EV platform development and manufacturing line conversion. The substantial improvement in investing cash flow from -₩10.15 trillion to -₩4.96 trillion is explained primarily by movements in long-term financial instruments (+₩2.83 trillion) and other current financial assets (+₩2.81 trillion), which represent internal capital reallocation rather than any structural reduction in investment intensity. Readers should not interpret the investing cash flow improvement as a retreat from EV or SDV investment.
Shareholder Returns and Leverage Direction
Financing outflows included ₩2.56 trillion in dividends and ₩0.70 trillion in share repurchases, bringing total shareholder returns to ₩3.26 trillion — equivalent to 61.7% of FY2025 FCF. Debt repayment activity continued: net short-term borrowings declined ₩0.01 trillion and bond repayments totaled ₩0.63 trillion, sustaining the deleveraging trajectory visible in the balance sheet. Management has maintained a consistent capital allocation posture — return capital to shareholders, reduce financial leverage, and fund organic growth through operating cash — with no indication that this framework is changing.
Key Findings
Tariff Risk: One-Time Recognition or Recurring Structural Cost?
The ₩755 billion Q1 FY2026 U.S. tariff charge represents a concentrated single-quarter recognition, and management has maintained its full-year FY2026 operating profit guidance of ₩10.2 trillion. The operational response outlined during the April 24 IR conference call includes increasing domestic factory export volumes approximately 5% versus the prior year and rerouting supply disruptions caused by Middle East market constraints to alternative markets. The condition on guidance delivery is binary: if U.S. tariff rates remain at current levels throughout the year, the charge will recur each quarter rather than represent a one-time absorption. Reaching the guided full-year OPM of 8.3% requires the remaining three quarters to generate ₩8.0 trillion in combined operating profit, implying a quarterly average of ₩2.66 trillion. That is a tighter path than the FY2025 exit rate implies, and any tariff escalation would narrow it further. The question of whether tariff levels are politically negotiable — through bilateral agreements, local manufacturing commitments, or production localization — is currently the single largest variable in the FY2026 earnings outcome and one that financial analysis alone cannot resolve.
EV Mix Expansion and the Warranty Cost Paradox
EV unit sales of 86,000 units represent a 54.1% year-on-year increase, while hybrid sales of 138,000 units grew 32.1%, lifting the combined eco-friendly vehicle share to 29.7% of total wholesale volume. Kia's global retail market share reaching 4.1% marks a company record. The economic complexity is that EV units carry materially higher per-vehicle warranty provisions than internal combustion engine vehicles, partly due to higher component replacement values and partly because new EV platforms are historically claims-intensive in their first one to two years of production. Of the ₩440 billion incremental warranty expense in Q1 FY2026, approximately ₩190 billion is attributable to the higher EV sales mix and is structural in nature. The paradox is that volume growth in EVs, absent per-unit warranty cost improvement, creates a proportional OPM drag that scales with EV penetration. Resolving this requires explicit progress on battery reliability, supply chain cost, and platform maturity — volume growth alone does not close the gap.
Foreign Currency Exposure Within the Warranty Provision
The ₩250 billion warranty provision revaluation in Q1 FY2026 arose because Kia accrues overseas sales warranty liabilities in local currency (principally U.S. dollars) while consolidating financial statements in Korean won. When the won depreciates sharply, the translated value of these foreign-currency provisions increases, generating a non-cash operating charge. This is structurally similar to translation exposure but is routed through operating income rather than other comprehensive income, which means it directly affects the OPM line and creates quarterly volatility that has no relation to underlying pricing, cost discipline, or claims experience. If the won recovers, the ₩250 billion in revalued provisions could partially reverse into income; if it weakens further, additional revaluation charges would accumulate. Analysts benchmarking Kia's quarterly OPM need to isolate this FX-driven component to avoid misreading underlying business trends.
Volume Stagnation, Mix Improvement, and ASP Dynamics
Wholesale unit sales of 779,741 were just 0.9% above Q1 FY2025, yet revenue grew 5.3% — implying meaningful average selling price improvement driven by product mix rather than volume. High-value SUVs including Telluride and Sorento, combined with a greater proportion of premium-trim EV variants, drove the ASP increase. European incentive escalation of ₩215 billion partially offset North American and domestic market pricing strength. Kia's 2030 target of 4.13 million units at ₩170 trillion revenue implies an ASP roughly 15% higher than current levels, which requires continued mix elevation and pricing discipline rather than relying on volume expansion alone. The Q1 FY2026 ASP trajectory is directionally consistent with that path, though the sustainability of premium pricing in a competitively intensifying European market warrants monitoring.
Full-Year Guidance and the Path to ₩10.2 Trillion
Management's FY2026 targets are 3.35 million units (+6.8% year-on-year), ₩122.3 trillion revenue (+7.2%), and ₩10.2 trillion operating profit at an 8.3% OPM. With ₩2.21 trillion booked in Q1, the remaining three quarters must deliver ₩8.0 trillion cumulatively, or approximately ₩2.66 trillion per quarter on average. The FY2025 second-half recovery trajectory — Q3 FY2025 estimated at approximately ₩1.9 trillion and Q4 FY2025 estimated at approximately ₩2.5 trillion in operating profit — is consistent with the required quarterly run rate, but only if tariff pressure moderates. Middle East volume recovery, estimated at approximately 260,000 units on an annualized basis per the conference call, represents an additional tailwind if geopolitical conditions permit normalization. Looking further ahead, the SDV platform launches planned for early 2028 represent a potential structural inflection point — moving Kia from hardware margins toward software-enabled recurring revenue streams that carry fundamentally different economics than today's vehicle manufacturing business.
Outlook
Kia enters the balance of FY2026 with a structurally sound balance sheet, ₩21.66 trillion in liquid assets, and a product mix pivoting toward higher-margin SUVs and EVs. The FY2022–2024 supercycle — driven by supply constraints, favorable pricing power, and pandemic-era demand recovery — has clearly ended, and FY2025–2026 represents the normalization phase. The Q1 FY2026 OPM of 7.5%, when adjusted for the tariff charge, implies an underlying profitability of approximately 10.0%, which is consistent with cycle-normalized performance rather than cycle-trough deterioration. This distinction matters considerably for how investors should position around the current margin level.
The bull thesis rests on three pillars. First, the tariff cost is politically negotiable and may be partially mitigated through manufacturing localization, supply chain reconfiguration, and bilateral trade negotiation — outcomes the market cannot price with precision today. Second, the EV ramp is generating ASP-positive mix effects that will become increasingly visible as new EV platforms mature and per-unit warranty costs decline through reliability improvement. Third, the capital allocation framework — ₩3.26 trillion in shareholder returns against ₩5.29 trillion in FCF at a 61.7% payout ratio — demonstrates disciplined balance between shareholder returns and investment without balance sheet stress.
The primary risk is tariff permanence. If U.S. tariff rates remain at current levels or escalate across multiple quarters, the annualized operating profit impact would be in the range of ₩2.5–3.0 trillion, structurally repricing the sustainable OPM range from approximately 10% toward 8–9%. The secondary risk is the EV warranty cost trajectory: 54.1% year-on-year EV volume growth is strategically impressive, but if per-unit warranty cost does not decline as platforms mature, OPM dilution will be a recurring feature of the EV growth story rather than a transitional cost. The won/dollar exchange rate adds a volatility layer to quarterly OPM reporting that is independent of underlying business quality and complicates period-to-period comparisons.
Management's decision to maintain full-year guidance despite a difficult Q1 start signals operational confidence, but guidance credibility will be tested in Q2 and Q3, when the market can directly observe whether the tariff burden is being absorbed through pricing adjustments, manufacturing cost reduction, or continued incentive escalation. The ₩10.2 trillion full-year target is achievable but does not allow for further tariff escalation, sustained won depreciation, or material demand deterioration in core markets simultaneously. The next two quarters will determine whether FY2026 ends near guidance or whether a downward revision becomes necessary — and that outcome hinges as much on geopolitical and macroeconomic variables as on Kia's own operational execution.
Accounting Notes
Revenue recognition is applied at the point of vehicle delivery. Inventory is carried at cost using FIFO methodology; K-IFRS prohibits LIFO, which limits direct comparability with U.S. peers such as GM and Ford. Kia reports as a single business segment — automotive manufacturing and sales — per its DART disclosures; Kia Capital and other financial subsidiaries are consolidated but not separately segmented. Non-current bonds payable stand at ₩0.98 trillion as of FY2025 year-end, with minimal net movement in short-term borrowings, sustaining the low-leverage posture. No specific material contingent liabilities were identified in the preliminary earnings disclosure; warranty provisions are fully reflected in reported operating income. Detailed EV warranty claim trends and executive remuneration data will be available following the formal Q1 FY2026 quarterly report filing.
This report has been prepared for informational purposes only, based on Kia's FY2025 Annual Business Report filed with DART (rcept_no 20260312001224), Q1 FY2025 Quarterly Report (rcept_no 20250515001947), Q1 FY2026 Preliminary Earnings Disclosure (rcept_no 20260424800317), and publicly available IR conference call materials. It does not constitute investment advice, a solicitation to buy or sell any security, or a guarantee of future performance. All figures are derived from publicly disclosed sources; forward-looking statements reflect management guidance and analyst interpretation of publicly available data. Analysis date: May 14, 2026.