Where Samsung’s ₩88 trillion went — and why the memory business is the real profit engine
Quick Recap
Part 2 left us with a mystery. Samsung’s FY2025 gross profit was ₩131.4T, but its final operating income was only ₩43.6T. That’s ₩88 trillion (~$64B) unaccounted for. Today we’ll find out where it went.
Short answer: it was spent on Selling, General & Administrative expenses (SG&A). Once you subtract SG&A from gross profit, you get Operating Income — the truest measure of how well a company’s core business is actually running.
— — —
1. What Is SG&A?
SG&A is “money spent running the business, but not money spent directly making the product.”
Back to the bakery. COGS was flour, butter, and the baker’s wages. SG&A is store rent, the sign outside, the owner’s salary, the delivery driver, and the money spent on a local newspaper ad. None of those go into a loaf of bread directly, but without them the bakery can’t operate.
Typical SG&A line items: salaries of sales and admin staff, advertising, R&D, depreciation of offices and stores, marketing. A factory worker’s wage is in COGS; the CFO’s salary is in SG&A. That’s the key distinction.
— — —
2. Dissecting Samsung’s SG&A
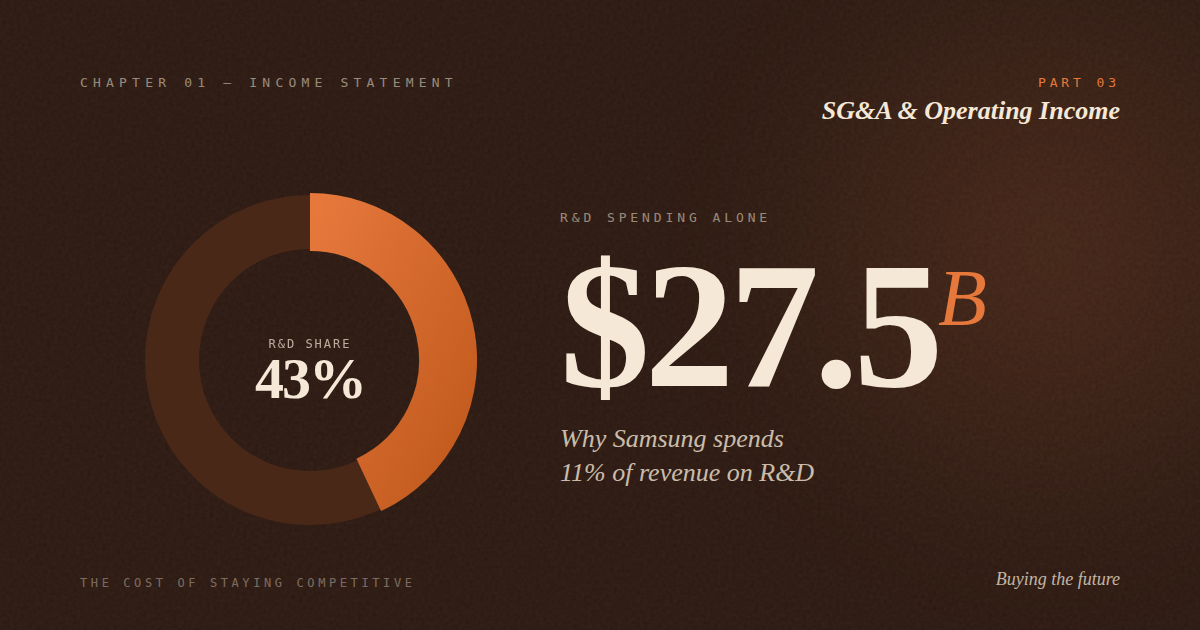
Samsung’s FY2025 consolidated SG&A was ₩87.8 trillion (~$64B). That’s 26.3% of revenue. But when you break it out by category, one number jumps off the page.
| Category | FY2025 (₩T) | Share |
|---|---|---|
| R&D (ongoing) | 37.7 | 43% |
| Fees paid | 9.8 | 11% |
| Salaries | 9.2 | 11% |
| Sales promotion | 8.2 | 9% |
| Advertising | 6.0 | 7% |
| Other | 16.8 | 19% |
Source: Samsung Annual Report, Note 22
R&D alone: ₩37.7 trillion. That’s 43% of all SG&A, and about 11.3% of revenue. Whether that’s a lot or a little depends on context — so let’s compare.
— — —
3. Why Does Samsung Spend 11% of Revenue on R&D?
Here’s how Samsung stacks up against other tech giants on R&D intensity:
| Company | R&D % of Revenue |
|---|---|
| Apple | ~8% |
| TSMC | ~8% |
| Samsung | ~11% |
| Intel | ~17% |
Approximate figures from latest annual filings
Samsung spends a higher share than Apple or TSMC. Why? Because in memory chips and smartphone components, a single year behind in technology is nearly impossible to catch up. Every DRAM generation needs smaller process nodes. Every flagship phone needs a better camera module and application processor. Cutting R&D would boost current-year profit, but three years out, SK Hynix and Micron pass Samsung in memory, Chinese brands eat its phone share, and the moat is gone.
Think of it this way: if Samsung cut R&D from ₩38T to ₩30T, operating income would jump to ₩50T+ next year. The stock might love it — for a quarter. But three years later, the company would be uncompetitive. R&D is how Samsung buys its future at the price of today’s profit. This is the dynamic behind every heavy-R&D tech company.
— — —
4. Operating Income: The True Test of the Business
Subtract SG&A from gross profit and you get Operating Income. Samsung FY2025: ₩131.4T − ₩87.8T = ₩43.6T (~$31.8B).
Divide by revenue and you get an operating margin of 13.1%. Operating income is the purest measure of how profitable the core business actually is — after paying for production, marketing, R&D, admin, everything. It excludes one-time items and financial decisions like how the company funds itself. Just the business, operating.
The three-year trend shows a dramatic recovery:
| Fiscal Year | Operating Income (₩T) | Operating Margin |
|---|---|---|
| FY2023 | 6.6 | 2.5% |
| FY2024 | 32.7 | 10.9% |
| FY2025 | 43.6 | 13.1% |
Operating income trend
Operating income went from ₩6.6T to ₩43.6T — a 6.6× increase — in two years. Revenue grew only 29% over the same window. How does this happen? The operating leverage we met in Part 2 gets even stronger here. Gross profit grew by ₩53T while SG&A grew by only ₩16T — meaning roughly 70% of the additional gross profit dropped straight to operating income. That’s what operating leverage looks like on the way up.
— — —
5. The Segment Plot Twist
Here’s where it gets interesting. Samsung’s annual report (Note 30) breaks operating income down by business segment.
| Segment | Revenue (₩T) | Op. Income (₩T) | Op. Margin |
|---|---|---|---|
| DX (phones & appliances) | 188.0 | 12.9 | 6.8% |
| DS (semiconductors) | 130.1 | 24.9 | 19.1% |
| SDC (displays) | 29.8 | 4.1 | 13.8% |
| Harman (auto audio) | 15.8 | 1.5 | 9.7% |
Source: Samsung Note 30, Segment Reporting, FY2025
DX has more revenue, but DS (semiconductors) makes nearly 2× the operating income. The semiconductor segment runs at a 19.1% operating margin while the phone segment runs at 6.8%. Samsung’s true profit engine is memory, not phones.
We hinted at this in Part 1 — “Samsung is really a chip company.” Here it’s proved. Each ₩1 of DX revenue generates ₩0.068 of operating income. Each ₩1 of DS revenue generates ₩0.191 — nearly 3× as profitable. If you hold Samsung stock, you mostly own a memory company with a large smartphone business attached.
— — —
6. The Cliffhanger
Here’s where we are. Samsung FY2025: ₩333.6T revenue → ₩131.4T gross profit → ₩87.8T in SG&A → ₩43.6T operating income. A great year by any measure.
But Samsung’s net income for FY2025 was ₩45.2T — ₩1.6T higher than operating income. That means Samsung made some extra money somewhere *outside* the core business.
More strangely, look at FY2023: operating income of only ₩6.6T — but net income of ₩15.5T. Net income was more than 2× operating income in a disaster year. How is that even possible?
The answer is in Part 4, where we finally cover Non-Operating Income, Taxes, and Net Income — the last three rows on the income statement. Samsung’s FY2023 tax situation alone will explain why you can never, ever judge a company by net income alone.
— — —
Frequently Asked Questions
What’s included in SG&A (Selling, General & Administrative)?
Everything needed to run the business that isn’t directly making the product: salaries for sales/marketing/admin staff, advertising, R&D, rent and depreciation of offices, legal fees, consulting fees, and insurance. In some companies R&D is broken out separately; Samsung includes ongoing R&D within SG&A.
What’s the difference between operating margin and gross margin?
Gross margin measures profitability after direct production costs only. Operating margin goes further — subtracting all the other costs of running the business too. Gross margin shows product economics; operating margin shows whole-business economics.
Is a high R&D spend good or bad for investors?
It depends. In technology businesses where staying competitive requires continuous innovation (semiconductors, pharmaceuticals), high R&D is a necessity — cutting it would destroy future earnings. In mature, stable industries, heavy R&D without clear returns is a warning sign. Always compare R&D intensity to industry peers.
Why do analysts focus on operating income rather than net income?
Operating income reflects only the ongoing business. Net income can be distorted by one-time items — asset sales, tax changes, unusual financial gains — that don’t repeat. When comparing companies or tracking trends, operating income tells a cleaner story about the underlying business.
Next: Part 4 — Non-Operating Income, Taxes & Net Income: Why Samsung’s 2023 Net Income Was 2× Its Operating Income.