FocusKeyword: Hyundai Mobis financial analysis
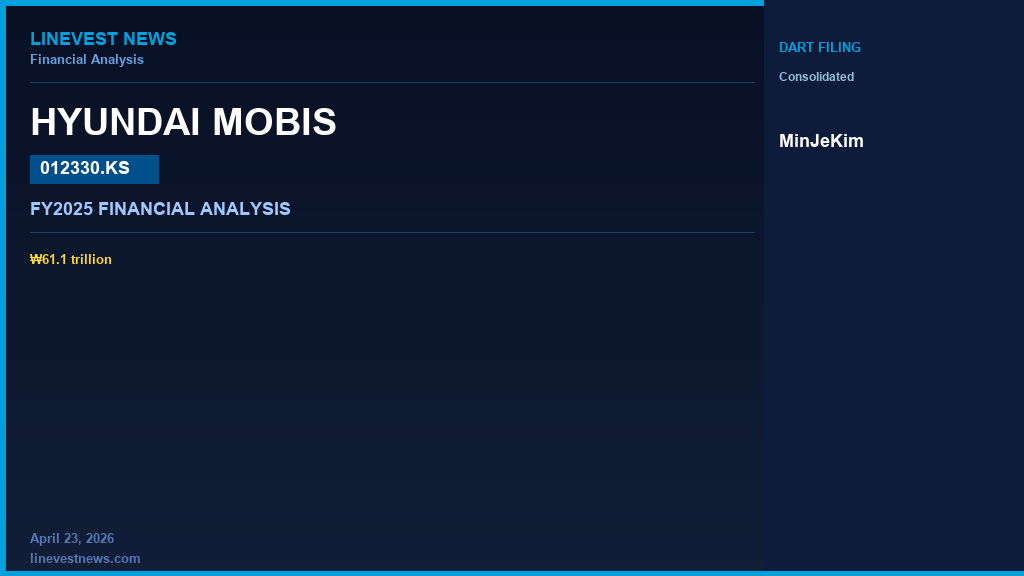
Hyundai Mobis (012330.KS) | FY2025 Financial Analysis
"Revenue and Operating Profit Both Rise, Yet Net Income Moves in Reverse — Non-Operating Income Normalization and Surging Tax Burden Dilute the Gains"
Source: 사업보고서 (2025.12) — Filed 2026.03.09 with DART | Consolidated Financial Statements | Unit: KRW millions
From a Hyundai Mobis financial analysis standpoint, FY2025 was a year in which the company simultaneously achieved revenue of ₩61.1 trillion (YoY +6.8%) and operating profit of ₩3.36 trillion (YoY +9.2%), marking improvement in both top-line scale and core-business profitability. Net income, however, came in at ₩3.66 trillion, down 9.7% from the prior year (₩4.06 trillion), moving in the opposite direction from the operating profit trend. The primary cause was a sharp surge in cash-basis income tax payments (prior year ₩672.0 billion → current year ₩1.21 trillion, +79.9%), which substantially expanded the tax burden relative to the prior year; meanwhile, FCF reached ₩3.12 trillion, up 52.5% from the prior year (₩2.05 trillion), reflecting a clear improvement in free cash generation capacity.
Key Financial Highlights
Item | Prior (₩M) | Current (₩M) | YoY |
Revenue (₩M) | 57,236,995 | 61,118,127 | ▲6.8% |
Operating Income (₩M) | 3,073,456 | 3,357,456 | ▲9.2% |
Op. Margin | 5.4% | 5.5% | |
Net Income (₩M) | 4,060,161 | 3,664,736 | ▼9.7% |
Net Margin | 7.1% | 6.0% | |
Operating Cash Flow (₩M) | 4,252,694 | 4,472,515 | ▲5.2% |
Free Cash Flow-FCF (₩M) | 2,048,614 | 3,124,745 |
1. Revenue and Profitability
1-3. Profitability Analysis
Item | Prior (₩M) | Current (₩M) | YoY |
Revenue (₩M) | 57,236,995 | 61,118,127 | ▲6.8% |
Operating Income (₩M) | 3,073,456 | 3,357,456 | ▲9.2% |
Net Income (₩M) | 4,060,161 | 3,664,736 | ▼9.7% |
Op. Margin | 5.4% | 5.5% | |
Net Margin | 7.1% | 6.0% |
The operating profit margin improved for three consecutive years: 3.9% (two years prior) → 5.4% (prior year) → 5.5% (current year). The net profit margin, by contrast, fell 1.1 percentage points from 7.1% (prior year) to 6.0% (current year). Two factors drive this divergence.
First, prior-year net income (₩4.06 trillion) exceeded operating income (₩3.07 trillion) by ₩986.7 billion. This was the result of large-scale non-operating positive items — such as equity-method gains or foreign-exchange-related financial income — being recognized. In the current year, this excess narrowed sharply to ₩308.7 billion (net income ₩3.66 trillion minus operating income ₩3.36 trillion), normalizing the gap between operating income and net income.
Second, cash-basis income tax payments surged to ₩1.21 trillion in the current year, a ₩537.1 billion increase over the prior year (₩672.0 billion). This amount represents 27% of operating cash flow (₩4.47 trillion) — a material proportion — and the corresponding increase in income tax expense on the income statement directly pressured net income.
2. Cost Structure
Cost Item | Prior (₩M) | Prior % | Current (₩M) | Curr % | YoY |
(데이터 없음) | - | - | - | - | - |
DOL (Degree of Operating Leverage) = 1.36
A DOL of 1.36 is positive and exceeds 1.0×. This indicates a low-to-moderate operating leverage structure in which a 1% increase in revenue produces approximately a 1.36% increase in operating profit. Because leverage is not excessive, operating profit's resilience to revenue fluctuations is relatively stable.
With revenue growing 6.8% year-over-year, the 9.2% rise in operating profit confirms that cost growth was held below the rate of revenue growth. Specifically, a DOL of 1.36 is consistent with operating profit growth (9.2%) being approximately 1.36× the rate of revenue growth (6.8%). This means that at least one of variable costs (cost of sales) or fixed costs (SG&A) grew at a rate lower than revenue growth (6.8%). The annual report discloses a classification of costs by nature (Note 30) and a breakdown of selling and administrative expenses (Note 31); within the scope of the DART API data available, the increase in operating profit is attributable to a modest improvement in either the cost-of-sales ratio or the SG&A ratio, or both.
3. Balance Sheet
3-1. Assets
Item | Prior (₩M) | Current (₩M) | YoY |
Total Assets | 66,596,905 | 70,400,532 | ▲5.7% |
Current assets rose 6.8% from the prior year, slightly exceeding the 5.7% growth rate of total assets. Capital expenditure (CapEx) for the current year was ₩1.35 trillion, down 38.9% from the prior year (₩2.20 trillion). This suggests the large-scale capital investment cycle concentrated in the prior year — focused on electrification components and electronic systems — has largely concluded; it also contributed to a 29.5% reduction in investing cash outflows, from −₩4.59 trillion (prior year) to −₩3.23 trillion (current year). Non-current assets include investments in associates and joint ventures (Note 15), whose carrying-value changes are reflected on the income statement through equity-method gains and losses.
3-2. Liabilities
Item | Prior (₩M) | Current (₩M) | YoY |
Current Liabilities | 12,745,182 | 13,057,963 | ▲2.5% |
Non-current Liabilities | 7,733,491 | 8,129,774 | ▲5.1% |
Total Liabilities | 20,478,673 | 21,187,737 | ▲3.5% |
Both current liabilities (+2.5% vs. prior year) and non-current liabilities (+5.1% vs. prior year) increased. Non-current liabilities grew faster than current liabilities, indicating a shift toward a longer maturity profile for borrowings. The debt-to-equity ratio was 0.44× in both the prior year and the year before that, and improved marginally to 0.43× in the current year. The current ratio improved to 2.33× from 2.23× in the prior year, confirming adequate short-term debt-servicing capacity. Interest coverage ratio data is not available; judgment on that metric is withheld.
3-3. Equity
Item | Prior (₩M) | Current (₩M) | YoY |
Common Stock | 491,096 | 491,096 | ▼0.0% |
Retained Earnings | 42,911,192 | 45,224,557 | ▲5.4% |
Total Equity | 46,118,232 | 49,212,795 | ▲6.7% |
Retained earnings increased from ₩42.91 trillion (prior year) to ₩45.22 trillion (current year), a net increase of ₩2.31 trillion. Net income for the current year, however, was ₩3.66 trillion. The difference of approximately ₩1.35 trillion between the net increase in retained earnings (₩2.31 trillion) and net income (₩3.66 trillion) is composed of: (1) actual dividends paid of ₩583.4 billion (per the financing cash flow statement, Note 28), (2) treasury share repurchases of ₩414.5 billion, and (3) the remaining ₩351.1 billion attributable to other comprehensive income movements and other capital adjustments. The full difference cannot be attributed to dividends alone. Cash dividend payment details are disclosed in Note 28 (Dividends) of the annual report, and this amount has been deducted from retained earnings.
Total equity increased from ₩46.12 trillion (prior year) to ₩49.21 trillion (current year), a net increase of ₩3.09 trillion. The difference of ₩781.1 billion between this figure and the net increase in retained earnings (₩2.31 trillion) is attributable to net movements in other comprehensive income (foreign currency translation differences, remeasurements of defined benefit plans, fair value changes, etc.).
4. Cash Flow Analysis
Item | 2Y Prior (₩M) | Prior (₩M) | Current (₩M) |
Operating Cash Flow | 5,342,631 | 4,252,694 | 4,472,515 |
Capital Expenditure (CapEx) | 1,801,887 | 2,204,080 | 1,347,770 |
Investing Cash Flow | -2,541,385 | -4,589,092 | -3,233,689 |
Financing Cash Flow | -1,889,401 | -254,984 | -1,204,688 |
Ending Cash | 5,079,414 | 4,788,492 | 4,922,378 |
Income Tax Paid | 766,976 | 671,973 | 1,209,152 |
Free Cash Flow (FCF) | - | 2,048,614 | 3,124,745 |
Operating cash flow was ₩4.47 trillion, up 5.2% from the prior year (₩4.25 trillion). Investing cash outflows were ₩3.23 trillion, down 29.5% from the prior year (−₩4.59 trillion), driven decisively by the 38.9% reduction in CapEx from ₩2.20 trillion (prior year) to ₩1.35 trillion (current year). As a result, FCF expanded from ₩2.05 trillion (prior year) to ₩3.12 trillion (current year), a 52.5% increase (FCF = operating CF − CapEx basis). The primary reason FCF improved so substantially versus the prior year is the reduction in capital expenditures as the CapEx cycle passed its peak.
Financing cash outflows were ₩1.20 trillion, surging from the prior year (−₩254.9 billion). This indicates a sharp increase in cash outflows from financing activities, such as net repayment of borrowings or expanded dividend payments.
Income tax payments in the current year reached ₩1.21 trillion, equal to 27.0% of operating CF (₩4.47 trillion). This figure — up 79.9% from the prior year (₩672.0 billion → ₩1.21 trillion) — is the key cash outflow factor that offset a significant portion of operating CF growth.
5. Key Financial Ratios
Ratio | 2Y Prior | Prior | Current |
Operating Margin | 3.9% | 5.4% | 5.5% |
Net Margin | 5.8% | 7.1% | 6.0% |
ROE | 8.4% | 8.8% | 7.4% |
ROA | 5.8% | 6.1% | 5.2% |
Current Ratio | - | 2.23x | 2.33x |
D/E Ratio | 0.44x | 0.44x | 0.43x |
The operating profit margin has maintained a three-year consecutive improvement trend at 3.9% (FY2023), 5.4% (FY2024), and 5.5% (FY2025), demonstrating that the efficiency of core-business profit generation continues to rise. ROE, by contrast, declined from 8.4% (two years prior) and 8.8% (prior year) to 7.4% in the current year — a result of total equity growing 6.7% while net income fell 9.7%. ROA also fell from 6.1% (prior year) to 5.2% (current year). The decline in the net profit margin (7.1% → 6.0%) weighed on all return-based metrics, making FY2025 a year in which operating-profit-based indicators (operating margin) and net-income-based indicators (net margin, ROE, ROA) moved in opposite directions.
The current ratio of 2.33× (vs. 2.23× in the prior year) significantly exceeds the general industry safety threshold of 1.5×, confirming ample short-term liquidity. The debt-to-equity ratio of 0.43× is in line with the prior and prior-prior years (0.44×), confirming that financial soundness is being maintained at a stable level.
6. Key Implications and Outlook
Growth Catalysts
1. CapEx Cycle Past Its Peak and FCF Recovery: Current-year CapEx was ₩1.35 trillion, down 38.9% from the prior year (₩2.20 trillion), expanding FCF to ₩3.12 trillion. The large-scale capital investment cycle of the prior year — focused on electrification components and electronic systems — has largely concluded, and the company has secured the capacity to allocate surplus cash to shareholder returns or additional growth investments.
2. Operating Profit Margin Improved for Three Consecutive Years: The operating profit margin has continued to improve from 3.9% (FY2023) to 5.4% (FY2024) to 5.5% (FY2025). Against the backdrop of structurally growing demand for high-value-added modules and electronic components driven by the electrification transition in the global automotive parts industry, Hyundai Mobis's improving core-business profitability trend is aligned with this structural shift.
3. Robust Financial Soundness: A debt-to-equity ratio of 0.43× and a current ratio of 2.33× — a conservative financial structure — provide a buffer against interest rate environment changes and industry uncertainty. With total equity expanding to ₩49.21 trillion, the company is well-positioned to support future strategic M&A or research and development investment.
4. Continued Top-Line Revenue Growth: Revenue of ₩61.1 trillion (+6.8%) represents a rebound after a slight decline from ₩59.3 trillion two years prior. The direct foundation for this revenue growth is the expansion of Hyundai Motor and Kia's global sales and growing demand for after-sales parts (module and core component supply).
Risks
1. Surging Tax Burden Is a Direct Pressure on Net Income: Income tax payments in the current year reached ₩1.21 trillion, up 79.9% (₩537.1 billion) from the prior year. If this level of tax burden increase persists, net profit margin recovery will be constrained even as operating profit improves.
2. Weakening Non-Operating Income Base Is a Direct Pressure on ROE and ROA: The prior-year non-operating positive base — in which prior-year net income (₩4.06 trillion) exceeded operating income (₩3.07 trillion) by ₩986.7 billion — contracted to ₩308.7 billion in the current year. Volatility in equity-method income or financial income constitutes a structural risk that undermines the stability of net income.
3. U.S. Tariff Policy Is a Direct Pressure on Margins: As a Tier-1 supplier to Hyundai Motor and Kia, Hyundai Mobis supplies components for finished vehicles destined for the U.S. market. If the U.S. strengthens its automotive tariff policy, production adjustments by key customers or pressure on supply prices would directly affect Hyundai Mobis's revenue and cost-of-sales ratio.
4. Sharp Increase in Financing Cash Outflows: Financing cash flow widened from −₩254.9 billion (prior year) to −₩1.20 trillion (current year), a 372.5% increase. Cash outflows from debt repayment or expanded dividends limited the increase in period-end cash (+₩133.8 billion).
Overall Assessment
In FY2025, Hyundai Mobis simultaneously grew revenue and operating profit, sustaining its trajectory of improving core-business profitability, and FCF exceeded ₩3 trillion, reflecting strengthened cash generation capacity. However, a sharp increase in income tax payments and the normalization of non-operating income relative to the prior year reduced net income by 9.7%, causing ROE and ROA to retreat. The company's stable financial structure — a debt-to-equity ratio of 0.43× and a current ratio of 2.33× — is being maintained; however, the structure of the tax burden and volatility in non-operating gains and losses will be the key variables determining whether net income recovers going forward.
Disclaimer: This report is intended for informational purposes based on DART disclosed data and does not constitute investment advice.