FocusKeyword: Ottogi financial analysis
Ottogi (007310.KS) | FY2025 Financial Analysis
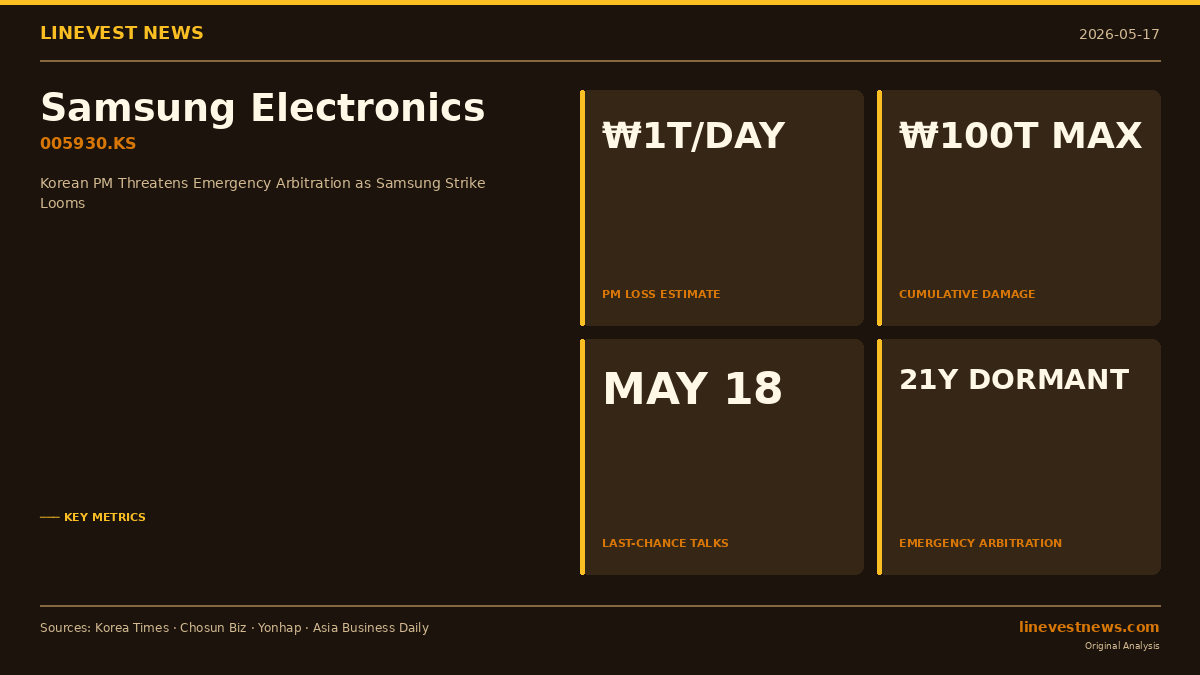
"Revenue Reaches ₩3,674.55B for Third Consecutive Year of Growth, Yet Operating Profit and Net Income Both Plunge"
Source: 사업보고서 (2025.12) — Filed 2026.03.18 with DART | Consolidated Financial Statements | Unit: KRW 100 millions (억원)
The core of this Ottogi financial analysis lies in the following figures. FY2025 consolidated revenue reached ₩36,745.5억원, a 3.8% increase year-over-year; however, operating profit fell to ₩1,772.5억원, a 20.2% plunge year-over-year, while net income collapsed to ₩721.4억원, a 47.6% drop. The extreme divergence between the revenue growth rate and the profit decline rate confirms that deterioration in the cost and expense structure has completely overwhelmed topline expansion — a conclusion supported across the financial statements in their entirety. The key growth driver is three consecutive years of revenue expansion; however, the most critical risk is the sustained decline in operating profit margin from 7.4% in FY2023 → 6.3% in FY2024 → 4.8% in FY2025 over three consecutive years.
Key Financial Highlights
Item | Prior (₩B) | Current (₩B) | YoY |
Revenue (₩B) | 35,391.2 | 36,745.5 | ▲3.8% |
Operating Income (₩B) | 2,220.1 | 1,772.5 | ▼20.2% |
Op. Margin | 6.3% | 4.8% | |
Net Income (₩B) | 1,376.0 | 721.4 | ▼47.6% |
Net Margin | 3.9% | 2.0% | |
Operating Cash Flow (₩B) | 3,611.1 | 2,188.7 | ▼39.4% |
Free Cash Flow-FCF (₩B) | 1,770.4 | 359.7 |
FCF for the current period stands at ₩359.7억원, remaining positive, but represents a 79.7% plunge from the prior period (₩1,770.4억원). The primary driver is the decline in operating cash flow (₩3,611.1억원 → ₩2,188.7억원), while CapEx of ₩1,829.0억원 remained broadly unchanged from the prior period (₩1,840.7억원).
1. Revenue and Profitability
1-3. Profitability Analysis
Item | Prior (₩B) | Current (₩B) | YoY |
Revenue (₩B) | 35,391.2 | 36,745.5 | ▲3.8% |
Operating Income (₩B) | 2,220.1 | 1,772.5 | ▼20.2% |
Net Income (₩B) | 1,376.0 | 721.4 | ▼47.6% |
Op. Margin | 6.3% | 4.8% | |
Net Margin | 3.9% | 2.0% |
Operating profit margin declined for three consecutive years: FY2023 7.4% → FY2024 6.3% → FY2025 4.8%. The fact that operating profit fell 20.2% while revenue grew 3.8% is directly explained by a DOL (Degree of Operating Leverage) of -5.27, which places the company in a negative-leverage zone. A simultaneous rise in the cost of goods sold ratio and an absolute increase in SG&A expenses combined to compress profitability.
Net income (-47.6%) declined far more steeply than operating profit (-20.2%). The operating profit decline amounted to ₩447.6억원 (₩2,220.1억원 → ₩1,772.5억원), whereas the net income decline amounted to ₩654.6억원 (₩1,376.0억원 → ₩721.4억원), meaning that more than ₩207억원 in additional earnings deterioration occurred below the operating profit line. The items recorded under financial income and financial expenses (Note 25) and other income and other expenses (Note 26) in the business report notes are the source of this gap; however, the DART API data used here does not provide a breakdown of non-operating income and expense figures. Income tax payments of ₩416.4억원 actually decreased compared to the prior period (₩480.8억원), confirming that an increase in tax burden is not the direct cause.
2. Cost Structure
Cost Item | Prior (₩B) | Prior % | Current (₩B) | Curr % | YoY |
(데이터 없음) | - | - | - | - | - |
- DOL (Degree of Operating Leverage) = -5.27 — The negative value places the company in a negative-leverage zone. Revenue increased 3.8% yet operating profit declined 20.2%, a result that means the profit contribution of revenue growth has been completely nullified.
As the DART API data for this period does not include a breakdown of expenses by nature, the cost structure is described based on the contents of Note 23 (Classification of Expenses by Nature) and Note 24 (Selling, General and Administrative Expenses) in the business report.
Note 23 of Ottogi's business report sets out expenses by nature including raw material costs, personnel costs, depreciation, and outsourcing costs. Given the characteristics of the food manufacturing industry, raw material costs (key inputs including wheat, soybeans, and palm oil) constitute the largest component of cost of goods sold, and fluctuations in global commodity prices pass through directly to the cost of goods sold ratio. The 1.5%p decline in operating profit margin from 6.3% in the prior period to 4.8% in FY2025 indicates that unit cost increases or volume increases in raw materials proceeded at a pace exceeding the revenue growth rate of 3.8%. SG&A expenses also expanded in absolute terms due to distribution and logistics cost pressures as well as personnel cost pressures. According to Note 24 of the business report, selling, general and administrative expenses include salaries, retirement benefits, freight and storage costs, and advertising expenses, and changes in the proportion of these items relative to revenue acted as an additional margin compression factor.
3. Balance Sheet
3-1. Assets
Item | Prior (₩B) | Current (₩B) | YoY |
Total Assets | 35,974.0 | 36,410.8 | ▲1.2% |
Total assets reached ₩36,410.8억원, a modest 1.2% increase from the prior period, with current assets also rising 1.5% to ₩15,012.7억원. CapEx (acquisition of property, plant and equipment) of ₩1,829.0억원 for the current period was nearly identical to the prior period (₩1,840.7억원). This reflects an investment pattern focused on maintaining existing production facilities and small-scale capacity additions rather than aggressive capacity expansion; investing cash outflows improved to -₩1,006.1억원 from -₩1,981.8억원 in the prior period, approximately half the prior-period level.
3-2. Liabilities
Item | Prior (₩B) | Current (₩B) | YoY |
Current Liabilities | 10,288.4 | 10,476.4 | ▲1.8% |
Non-current Liabilities | 3,870.3 | 3,906.4 | ▲0.9% |
Total Liabilities | 14,158.7 | 14,382.9 | ▲1.6% |
Current liabilities rose 1.8% to ₩10,476.4억원 and non-current liabilities rose 0.9% to ₩3,906.4억원, with both increasing modestly. The simultaneous increase in both current and non-current liabilities means there was no extreme shift in the maturity profile. However, the high proportion of current liabilities at 72.8% of total liabilities is attributable to the concentration of operating short-term liabilities such as trade payables and short-term borrowings, which is characteristic of the food manufacturing and distribution industry and in line with the sector average. The interest coverage ratio is not presented in the table as the data was not provided.
3-3. Equity
Item | Prior (₩B) | Current (₩B) | YoY |
Common Stock | 200.4 | 200.4 | ▼0.0% |
Retained Earnings | 20,112.0 | 20,331.3 | ▲1.1% |
Total Equity | 21,815.3 | 22,027.9 | ▲1.0% |
Retained earnings increased by a net ₩219.3억원, from ₩20,112.0억원 in the prior period to ₩20,331.3억원 in the current period. Despite net income of ₩721.4억원, the increase in retained earnings was only ₩219.3억원, producing a gap of ₩502.1억원. This gap is composed of two elements: actual dividends paid of ₩324.9억원 (per the financing cash flow statement) and the remaining ₩177.2억원 attributable to other comprehensive income movements (foreign currency translation differences and other capital adjustments). The full ₩502.1억원 gap cannot be attributed to dividends alone. Total equity was ₩22,027.9억원, a 1.0% increase from the prior period, with paid-in capital (₩200.4억원) and capital surplus remaining unchanged.
4. Cash Flow Analysis
Item | 2Y Prior (₩B) | Prior (₩B) | Current (₩B) |
Operating Cash Flow | 4,108.4 | 3,611.1 | 2,188.7 |
Capital Expenditure (CapEx) | 1,240.6 | 1,840.7 | 1,829.0 |
Investing Cash Flow | -1,030.3 | -1,981.8 | -1,006.1 |
Financing Cash Flow | -2,230.4 | -1,609.9 | -343.5 |
Ending Cash | 3,245.5 | 3,307.3 | 4,126.9 |
Income Tax Paid | 629.0 | 480.8 | 416.4 |
Free Cash Flow (FCF) | - | 1,770.4 | 359.7 |
Operating cash flow was ₩2,188.7억원, a 39.4% plunge from the prior period (₩3,611.1억원). This decline is far greater in magnitude than the operating profit decline (-20.2%), indicating that deterioration in working capital movements (increases in inventories and trade receivables, or decreases in trade payables) further eroded cash generation capacity. Income tax payments of ₩416.4억원 declined 13.4% from the prior period (₩480.8억원), partially cushioning the decline in operating CF.
Investing cash flow was -₩1,006.1억원, representing a 49.2% reduction in outflows from the prior period (-₩1,981.8억원). CapEx of ₩1,829.0억원 was similar to the prior period, but total investing outflows decreased.
Financing cash flow was -₩343.5억원, a 78.7% reduction in outflows from the prior period (-₩1,609.9억원).
Closing cash was ₩4,126.9억원, a 24.8% increase from the prior period (₩3,307.3억원). Despite the decline in operating CF, reduced outflows from investing and financing activities drove up the cash balance.
FCF for the current period is ₩359.7억원 and remains positive, but represents a 79.7% plunge from the prior period (₩1,770.4억원). FCF remained directionally positive; however, operating CF exceeded CapEx (₩1,829.0억원) by only ₩359.7억원, significantly narrowing the capacity for incremental investment.
5. Key Financial Ratios
Ratio | 2Y Prior | Prior | Current |
Operating Margin | 7.4% | 6.3% | 4.8% |
Net Margin | 4.7% | 3.9% | 2.0% |
ROE | 7.8% | 6.3% | 3.3% |
ROA | 4.6% | 3.8% | 2.0% |
Current Ratio | - | 1.44x | 1.43x |
D/E Ratio | 0.69x | 0.65x | 0.65x |
Across the three-year trend, all profitability metrics declined continuously. Operating profit margin fell 2.6%p over three years from 7.4% in FY2023 → 6.3% in FY2024 → 4.8% in FY2025, and net profit margin also dropped sharply from 4.7% → 3.9% → 2.0%. ROE declined in tandem from 7.8% → 6.3% → 3.3%, and ROA from 4.6% → 3.8% → 2.0%, demonstrating that the efficiency of capital and asset utilization has deteriorated for three consecutive years.
The debt-to-equity ratio remained stable and unchanged at 0.65x from FY2024 to FY2025, and a current ratio of 1.43x is not at a level indicative of a liquidity crisis. However, the sustained decline in ROE and ROA demonstrates that the earnings generation capacity itself is structurally weakening. Interest coverage ratio and per-share dividend payout data were not included in the DART API data provided for this period.
6. Key Implications and Outlook
Growth Catalysts
1. Three Consecutive Years of Revenue Expansion Maintained — Revenue grew steadily from ₩34,545.5억원 in FY2023 → ₩35,391.2억원 in FY2024 → ₩36,745.5억원 in FY2025. This confirms that the market position of key brands including ramyeon, curry, ketchup, and mayonnaise is being maintained, and the essential consumer staple nature of food consumption is sustaining the revenue base even amid economic uncertainty.
2. Rising Cash Holdings and Positive FCF Maintained — Closing cash increased to ₩4,126.9억원 (▲24.8%) and FCF of ₩359.7억원 remained positive, confirming the absence of a near-term liquidity crisis. The capacity to fund dividends and future capital expenditures exists.
3. Cash Preservation Through Reduced Investment and Financing Outflows — Both investing CF (-₩1,006.1억원) and financing CF (-₩343.5억원) saw substantially lower outflows compared to the prior period, offsetting the decline in operating cash flow to defend the cash balance. Should a macro environment of stable or declining commodity prices take shape, capacity for investment resumption alongside operating CF recovery will emerge.
Risks
1. Three Consecutive Years of Declining Operating Profit Margin — Structural Margin Compression — Operating profit margin declined 2.6%p from 7.4% in FY2023 to 4.8% in FY2025, and the direct driver of this margin compression is the combined effect of rising raw material costs and the fixed-cost nature of SG&A expenses — not a transitory factor. Should global prices for wheat, palm oil, and soybeans rise again due to geopolitical risk and climate change, further margin deterioration is unavoidable.
2. 79.7% Plunge in FCF — The collapse in FCF from ₩1,770.4억원 to ₩359.7억원 is a direct constraint on investment capacity, attributable to the weakening of operating cash generation. Maintaining CapEx at its current level (approximately ₩1,829억원) requires operating CF recovery as a prerequisite; if operating CF declines further, FCF may turn negative.
3. Tension Between Net Income Collapse and Continued Dividend — Despite a 47.6% plunge in net income (₩1,376.0억원 → ₩721.4억원), dividends of ₩324.9억원 were sustained. The dividend burden relative to earnings generation capacity is increasing, and a net profit margin of 2.0% is at a level that warrants scrutiny of dividend sustainability.
4. Risk of Entrenched Negative-Leverage Cost Structure — As the DOL of -5.27 indicates, the current cost structure places the company in a negative-leverage zone where operating profit declines even as revenue increases. If this structure becomes entrenched, the vicious cycle in which topline growth fails to translate into profit improvement will persist.
Overall Assessment
Ottogi recorded revenue of ₩36,745.5억원 in FY2025, extending its topline growth trajectory; however, the sharp declines in operating profit and net income clearly expose a cost structure problem in which revenue growth is failing to convert into earnings. Three consecutive years of declining operating profit margin and entry into a negative DOL zone demonstrate that an earnings recovery is not achievable without restoring cost competitiveness. Closing cash of ₩4,127억원 and positive FCF provide support for financial stability, and an immediate liquidity crisis is absent; however, the 79.7% plunge in FCF requires monitoring of medium-term investment capacity constraints and dividend sustainability. The direction of global commodity prices and the degree of SG&A efficiency improvement will be the key variables determining the path to profitability recovery going forward.
Disclaimer: This report is provided for informational purposes based on DART disclosure data and does not constitute investment advice.