Source: NAVER Annual Report (27th FY) — Filed March 13, 2026 | Consolidated Financial Statements | Unit: KRW millions
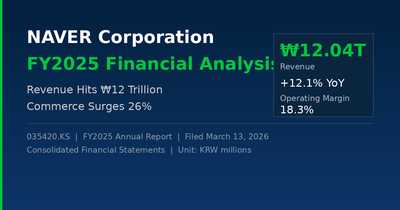
NAVER Corporation posted record consolidated revenue of ₩12.04 trillion in FY2025, up 12.1% year-on-year, driven by a 26.2% surge in its Commerce segment. This in-depth financial analysis covers NAVER's income statement, balance sheet, cash flow, segment breakdown, and key ratios — all drawn directly from the official annual report filed with the Korea Financial Supervisory Service.
📊 Key Financial Highlights at a Glance
NAVER's FY2025 results demonstrate steady top-line momentum, with revenue crossing the ₩12 trillion threshold for the first time. However, net income dipped 5.9% year-on-year as tax expenses surged 54% and one-off gains that boosted FY2024 results did not recur.
| Metric | FY2023 | FY2024 | FY2025 | YoY Change |
|---|---|---|---|---|
| Revenue | ₩9,670B | ₩10,737B | ₩12,039B | ▲12.1% |
| Operating Income | ₩1,493B | ₩1,981B | ₩2,210B | ▲11.6% |
| Operating Margin | 15.4% | 18.4% | 18.3% | — |
| Net Income | ₩1,789B | ₩1,936B | ₩1,821B | ▼5.9% |
| Operating Cash Flow | ₩2,001B | ₩2,591B | ₩3,097B | ▲19.5% |
| Free Cash Flow | ₩1,447B | ₩2,037B | ₩1,863B | ▼8.6% |
1. Revenue and Profitability Analysis
Revenue Growth: Three Consecutive Years of Double-Digit Gains
Consolidated revenue rose from ₩9.67T (FY2023) to ₩10.74T (FY2024) and ₩12.04T (FY2025), reflecting a 3-year compound annual growth rate of approximately 11.5%. All five business segments posted positive growth, though the pace varied significantly across divisions.
Segment Breakdown: Commerce Is the New Growth Engine
| Segment | FY2025 Revenue | % of Total | YoY Growth |
|---|---|---|---|
| Search Platform | ₩4,167B | 34.6% | ▲5.6% |
| Commerce | ₩3,682B | 30.6% | ▲26.2% |
| Fintech | ₩1,698B | 14.1% | ▲12.1% |
| Content | ₩1,902B | 15.8% | ▲5.7% |
| Cloud / Enterprise | ₩590B | 4.9% | ▲4.3% |
Search Platform remains the largest revenue contributor at 34.6% of total, but its growth rate of 5.6% trails the company average. Commerce, now at 30.6% of revenue, is closing the gap fast with 26.2% YoY growth. At this trajectory, Commerce could overtake Search Platform within two to three years — a structural shift that mirrors global platform evolution.
Fintech grew 12.1%, in line with the company overall, while Content (5.7%) and Cloud/Enterprise (4.3%) lagged behind. The revenue mix is diversifying, reducing dependence on advertising revenue.
Operating Income and Margin
Operating income reached ₩2.21T, up 11.6%, with an operating margin of 18.3% — nearly flat versus 18.4% in FY2024. Revenue growth was largely offset by proportional cost increases. That said, the margin has improved by approximately 3 percentage points from the 15.4% recorded in FY2023, signaling structural efficiency gains.
Why Net Income Fell Despite Strong Operations
Net income declined 5.9% to ₩1.82T despite solid operating performance. Two factors explain the gap. First, tax expenses jumped 54% from ₩390B to ₩601B due to higher taxable income and timing differences. Second, one-off gains collapsed — other income dropped from ₩733B (FY2024, largely from equity method gains) to ₩265B. Adjusting for these non-recurring items, underlying earnings quality improved.
2. Cost Structure: Fixed vs. Variable
Total operating expenses reached ₩9.83T. Of this, variable costs account for 66.5% (₩6.53T) and fixed costs for 33.5% (₩3.30T). As a platform business, NAVER's cost base is naturally skewed toward variable expenses that scale with transaction volume and user activity.
The single largest cost item is service fees (₩4.04T, 41.1% of total expenses) — covering partner settlement payments, payment processing fees, and outsourced operations. Marketing spend jumped 20.1% to ₩1.92T, reflecting intensifying competition in Commerce and Fintech customer acquisition. R&D expenditure rose to ₩2.23T, representing 18.5% of revenue — the highest R&D intensity among Korea's top 10 listed companies.
3. Balance Sheet Snapshot
Assets: Cash-Rich with Accelerating CapEx
Total assets stood at ₩41.1T at year-end. Cash and cash equivalents surged 42.6% to ₩5.98T, and including short-term financial instruments (₩2.34T), liquid assets total ₩8.3T — an exceptionally strong liquidity position. Property, plant & equipment jumped 24% to ₩3.61T, reflecting aggressive AI infrastructure buildout.
Equity: 95% Retained Earnings — A Pure Organic Story
Total equity reached ₩29.0T, of which retained earnings account for ₩27.6T (95.4%). NAVER's capital base has been built almost entirely through accumulated profits, not external financing. This structure reflects over two decades of disciplined earnings retention.
Liabilities: Short-Term Bond Maturity Needs Monitoring
Total liabilities were ₩12.1T, split between operating liabilities (₩6.25T, 52%) and financial liabilities (₩4.61T, 38%). One key flag: ₩1.60T in current bonds newly appeared on the balance sheet, representing long-term bonds reclassified as current due to approaching maturity. This repayment need is manageable given the ₩8.3T liquidity buffer, but warrants close monitoring.
4. Cash Flow Analysis
Operating Cash Flow: Consistent and Growing
Operating cash flow grew from ₩2.00T (FY2023) to ₩2.59T (FY2024) and ₩3.10T (FY2025) — a 55% increase over two years. This reflects genuine improvement in cash generation from core operations, supported by growing interest income from the company's expanding cash balance.
CapEx Surge Pressures Free Cash Flow
Capital expenditure (PP&E purchases) more than doubled, from ₩554B to ₩1.23T — a 122.9% year-on-year increase. This drove Free Cash Flow down from ₩2.04T to ₩1.86T, despite stronger operating performance. The investment is primarily directed at AI data centers and server infrastructure to support HyperCLOVA X.
Financing: Deleveraging While Raising Dividends
NAVER reduced short-term borrowings and repaid existing debt while simultaneously increasing its dividend payout 41.6% to ₩168B. No share buybacks were executed in FY2025 (vs. ₩405B in FY2024), though the company repurchased and cancelled ₩146B worth of treasury shares during the year.
5. Key Financial Ratios
| Ratio | FY2023 | FY2024 | FY2025 |
|---|---|---|---|
| Current Ratio | — | 153.9% | 136.3% |
| Debt-to-Equity | — | — | 41.9% |
| ROE | — | — | 7.1% |
| ROA | — | — | 4.4% |
| EBITDA Margin | — | — | 24.5% |
| R&D / Revenue | — | — | 18.5% |
NAVER's debt-to-equity ratio of 41.9% is among the lowest for large-cap Korean tech stocks, reflecting a conservatively financed balance sheet. The current ratio of 136.3% (down from 153.9%) is still healthy, though the short-term bond maturity noted above is a partial contributor to the slight decline.
ROE (7.1%) and ROA (4.4%) appear modest in isolation, but this is largely a retained earnings distortion effect — with ₩27.6T in accumulated equity, the denominator is very large. The company's absolute profit generation (₩1.95T attributable to parent shareholders) is substantial.
At 18.5% of revenue, NAVER's R&D intensity is among the highest of any Korean listed company, and significantly above global internet peers on a proportional basis. This reflects heavy investment in HyperCLOVA X, AI-powered search, autonomous mapping, and B2B cloud infrastructure.
6. Key Takeaways and Outlook
NAVER's FY2025 results present a company in healthy operational shape, executing a deliberate pivot from advertising-led growth toward a diversified, AI-augmented platform business. The ₩12T revenue milestone is meaningful, and the Commerce surge confirms that the strategic bet on e-commerce infrastructure is paying off at scale.
Key risks to watch:
- CapEx-driven FCF compression — if AI infrastructure spending remains elevated in FY2026, shareholder returns may face further pressure
- ₩1.6T current bond maturity — though manageable given the liquidity buffer
- Margin sustainability as depreciation from recently commissioned facilities ramps up
Upside drivers:
- R&D pipeline — HyperCLOVA X and AI-powered search
- Clean balance sheet with ₩8.3T in liquid assets
- Rapidly growing Commerce and Fintech segments positioning NAVER for the next phase of AI-driven platform expansion across Asia
Disclaimer: This report is for informational purposes only and does not constitute investment advice. All figures sourced from NAVER Corporation's 27th Annual Report filed March 13, 2026.