
Buldak Goes Global: Revenue Clears ₩2.35 Trillion as Overseas Share Hits 62%
Source: Samyang Foods Annual Report (65th FY) — Filed March 18, 2026 | Consolidated Financial Statements | Unit: KRW millions
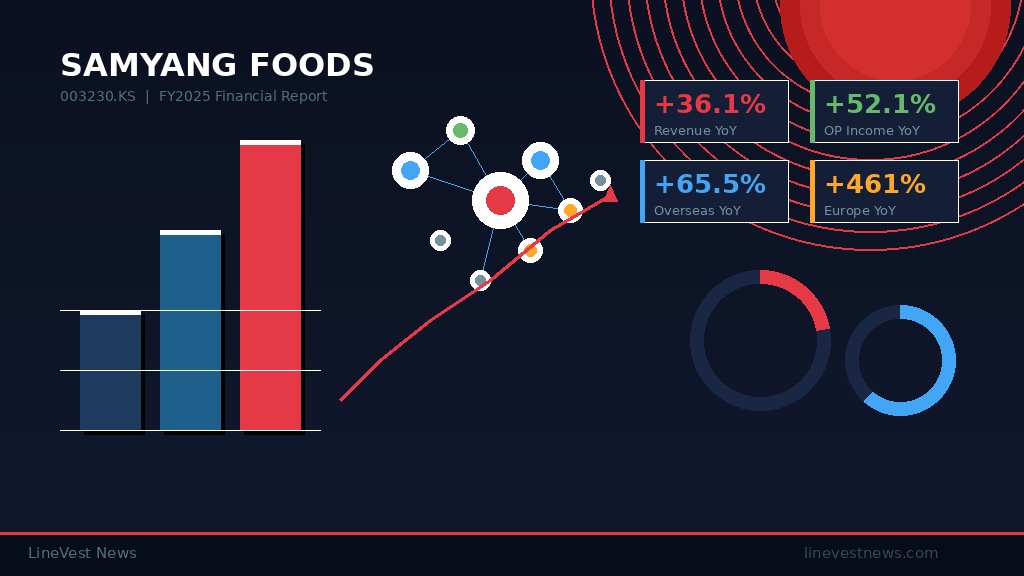
Samyang Foods posted record consolidated revenue of ₩2.35 trillion in FY2025, up 36.1% year-on-year, powered by explosive global demand for its Buldak brand. Operating income surged 52.1% to ₩524 billion as the company's margin structure improved significantly. This analysis draws directly from the company's official 사업보고서 filed with DART, covering the income statement, balance sheet, cost structure, cash flows, segment performance, and key financial ratios.
Key Financial Highlights at a Glance
| Metric | FY2025 | FY2024 | YoY |
| Revenue | ₩2.35T | ₩1.73T | ▲ 36.1% |
| Operating Income | ₩524.2B | ₩344.6B | ▲ 52.1% |
| Operating Margin | 22.3% | 19.9% | ▲ 2.4%p |
| Net Income | ₩388.7B | ₩271.3B | ▲ 43.3% |
| Operating CF | ₩309.3B | ₩357.9B | ▼ 13.6% |
| Free Cash Flow | −₩139.7B | +₩129.5B | FCF (-) |
1. Revenue and Profitability
Segment Breakdown: Noodles & Snacks Carry Everything
Samyang's revenue is almost entirely concentrated in its Noodles & Snack segment (면스낵), which accounts for 96.1% of food sales. The standout story is export growth: overseas sales within this segment surged 39.6% to ₩1,823.9B, confirming that Buldak's global viral appeal has translated into durable, scalable revenue.
| Segment | FY2025 (₩M) | Share | FY2024 (₩M) | Share | YoY |
| Noodles & Snacks | 2,155,518 | 96.1% | 1,586,613 | 96.1% | ▲ 35.9% |
| Sauce & Seasoning | 70,627 | 3.1% | 43,102 | 2.6% | ▲ 63.9% |
| Frozen Foods | 61,319 | 2.7% | 50,830 | 3.1% | ▲ 20.6% |
| Logistics Services | 94,797 | — | 64,691 | — | ▲ 46.5% |
| Total | 2,351,785 | 100% | 1,728,015 | 100% | ▲ 36.1% |
Sauce & Seasoning is the fastest-growing segment at +63.9%, with Buldak Sauce overseas exports up 92.1%. At this pace, the segment's revenue share will expand materially in FY2026.
Geographic Revenue: Overseas Share Crosses 60%
| Region | FY2025 (₩M) | Share | FY2024 (₩M) | Share | YoY |
| Korea | 904,139 | 38.5% | 853,527 | 49.4% | ▲ 5.9% |
| United States | 609,665 | 25.9% | 382,855 | 22.2% | ▲ 59.2% |
| China | 597,289 | 25.4% | 419,181 | 24.3% | ▲ 42.5% |
| Europe | 183,061 | 7.8% | 32,623 | 1.9% | ▲ 461% |
| Indonesia | 23,699 | 1.0% | 13,515 | 0.8% | ▲ 75.4% |
| Overseas Total | 1,447,647 | 61.5% | 874,488 | 50.6% | ▲ 65.5% |
Europe is the breakout story: the newly established European subsidiary (July 2024) generated ₩183B in its first full year, a 461% YoY increase. The U.S. surpassed ₩609B (+59%) with key entries into Kroger, Sam's Club, and Target. At this trajectory, overseas revenue will structurally dominate.
2. Cost Structure: Raw Material Dependency Is the Key Risk
Total operating expenses (매출원가 + 판관비) reached ₩1.83T. Variable costs account for 66.4% and fixed costs for 23.7%, with the balance in semi-variable items.
| Cost Category | FY2025 (₩M) | % of Total | FY2024 (₩M) | % of Total | YoY |
| Raw materials (incl. inventory adj.) | 945,239 | 51.7% | 744,665 | 53.8% | ▲26.9% |
| Export freight & logistics | 208,739 | 11.4% | 160,963 | 11.6% | ▲29.7% |
| Variable subtotal | 1,212,893 | 66.4% | 950,189 | 68.7% | ▲27.6% |
| Employee costs (salary + welfare) | 304,836 | 16.7% | 223,233 | 16.1% | ▲36.5% |
| Depreciation & amortisation | 63,749 | 3.5% | 46,025 | 3.3% | ▲38.5% |
| Fixed subtotal | 433,822 | 23.7% | 315,183 | 22.8% | ▲37.6% |
Raw material dependency is the single largest structural risk. Palm oil (정제유) prices rose 19.1% over three years to ₩1,776/kg. Both palm oil and wheat flour are 100% imported via the captive subsidiary Samyang Flour Mills — creating a direct pass-through channel from global commodity markets into COGS.
Despite palm oil headwinds, the gross margin improved from 34.9% (FY2023) to 44.8% (FY2025). The explanation is mix and FX: high-margin overseas Buldak sales dominate revenue growth, and a weaker Korean won lifts export revenues in KRW terms. Contribution margin (한계이익률) improved from 45.0% to 48.4%, yielding a Degree of Operating Leverage of 2.17x.
3. Balance Sheet: CapEx Cycle Underway
Total assets reached ₩2.20T, up 37.7% year-on-year. Tangible assets (유형자산) jumped 43.4% to ₩1.07T — the direct result of the Miryang Plant 2 completion (June 2025) and the China Jiaxing factory groundbreaking (July 2025, ₩207.2B investment). Capital expenditure tripled over two years from ₩45.0B (FY2023) to ₩449.0B (FY2025).
| Balance Sheet Item | FY2025 (₩M) | FY2024 (₩M) | YoY |
| Cash & equivalents | 332,841 | 334,821 | ▼ 0.6% |
| Trade receivables | 185,202 | 136,843 | ▲ 35.3% |
| Inventories | 245,011 | 148,020 | ▲ 65.5% |
| PP&E | 1,072,621 | 748,046 | ▲ 43.4% |
| Total Assets | 2,196,496 | 1,594,782 | ▲ 37.7% |
| Total Liabilities | 924,956 | 766,749 | ▲ 20.6% |
| Retained Earnings | 1,129,477 | 769,913 | ▲ 46.7% |
| Total Equity | 1,271,540 | 828,033 | ▲ 53.6% |
Equity is 88.8% retained earnings — Samyang has built its entire capital base organically from profits. Common stock (₩37.7B) has been unchanged for years, and no dilutive capital raises have occurred. The debt-to-equity ratio improved from 102.9% (FY2023) to 72.7% (FY2025) despite rising borrowings, as equity growth outpaced debt.
4. Cash Flow Analysis
For the first time, Samyang generated negative Free Cash Flow (FCF) in FY2025: −₩139.7B. Operating cash flow was ₩309.3B — solid in absolute terms but 13.6% below FY2024 due to a 148.6% surge in tax payments (₩112.3B) as earnings base expanded. Meanwhile, CapEx of ₩449.0B exceeded operating CF entirely.
| CF Item | FY2025 (₩M) | FY2024 (₩M) | FY2023 (₩M) |
| Operating CF | 309,287 | 357,905 | 168,100 |
| of which: tax paid | (112,306) | (45,177) | (28,032) |
| Investing CF | (478,971) | (214,310) | (23,712) |
| of which: PP&E purchases | (448,988) | (228,450) | (44,996) |
| Financing CF | 170,174 | (34,872) | (20,069) |
| of which: net borrowings | +126,313 | (20,285) | +8,424 |
| of which: treasury share disposal | 99,117 | 0 | 0 |
| Free Cash Flow | (139,701) | +129,455 | +123,104 |
The FCF deficit was funded by a combination of long-term bank borrowings (+₩290.6B gross new debt) and the disposal of treasury shares (+₩99.1B). This is deliberate CapEx financing, not operational stress — EBITDA and operating cash generation remain healthy.
5. Key Financial Ratios
| Ratio | FY2025 | FY2024 | FY2023 |
| ROE | 37.6% | 39.4% | 24.0% |
| ROA | 20.5% | 19.6% | 10.8% |
| Debt-to-Equity | 72.7% | 92.6% | 102.9% |
| Current Ratio | 157.1% | 137.4% | 122.4% |
| Interest Coverage | 43.4x | 28.0x | 13.1x |
| EPS (₩) | 52,156 | 36,468 | 16,929 |
| DPS (₩) | 4,800 | 3,300 | 2,100 |
| Payout Ratio | 9.2% | 9.0% | 12.4% |
| Dividend Yield | 0.4% | 0.4% | 0.9% |
ROE of 37.6% and interest coverage of 43.4x are exceptional by any benchmark, particularly for a food manufacturing company. The improving current ratio (157.1%) alongside a declining debt-to-equity ratio signals a balance sheet that is simultaneously strengthening and funding aggressive expansion.
6. Key Takeaways and Outlook
Samyang Foods' FY2025 results confirm a company executing a high-velocity global expansion while sustaining strong profitability. The ₩2.35T revenue milestone represents a nearly 2x increase from FY2023 in just two years — a pace rarely seen among Korean listed food companies.
Three risks warrant monitoring: (1) Raw material exposure — palm oil price increases (+19% over 3 years) are a direct margin headwind; if the won strengthens while palm oil rises, the current margin improvement trend could reverse. (2) CapEx-driven FCF pressure — China Jiaxing factory (₩207.2B) will extend negative FCF into FY2026, requiring continued debt financing. (3) Concentration risk — Noodles & Snacks at 96% of sales means Buldak brand risk is company-wide risk.
On the upside, the geographic diversification story is compelling. Europe (₩183B, +461%) is at an early inflection point. The U.S. is entering mainstream retail at scale. Commerce operating leverage — fixed costs growing slower than revenue — should widen margins further as the China factory comes online and unit economics improve.
Disclaimer: This report is for informational purposes only, based on DART-filed financial statements, and does not constitute investment advice.










